Youqiang Yu1 and Dapeng Zhao2
1 State Key Laboratory of Marine Geology, Tongji University, Shanghai, China,
2 Department of Geophysics, Tohoku University, Sendai, Japan
Abstract: Both laboratory experiments and seismic observations indicate that the solid Earth is composed of strongly anisotropic materials and its dynamics can be better constrained by exploring seismic anisotropy. Due to the limited number and poor depth resolution of currently available seismic anisotropy measurements, tectonic regimes of upper mantle deformations beneath Southern California still remain enigmatic and controversial. Here we present high-resolution three-dimensional models of P wave azimuthal and radial anisotropy in the crust and upper mantle beneath Southern California obtained by a joint inversion of local-seismic and teleseismic P wave data. Our results reveal significant depth-dependent anisotropy in which fast orientations in the lithospheric mantle closely follow the strike of the San Andreas fault and those in the asthenosphere are characterized as a predominantly circular pattern centered in the robust highvelocity Isabella anomaly beneath the Great Valley. The Isabella anomaly is possibly a remnant of the fossil Farallon slab and is currently experiencing a tectonic regime of lithospheric downwelling, contributing to the development of a circular asthenospheric flow. High-velocity anomalies are revealed below 300-km depth beneath areas surrounding the Great Valley, which may reflect the delaminated lithospheric segments. Different rifting processes may take place beneath the Inner Borderland and the Salton Trough whose developments are possibly related to regional mantle upwelling and lithospheric stretching, respectively.
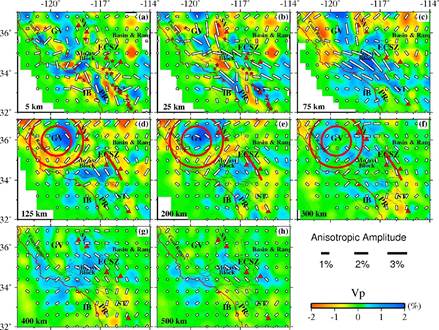
Figure 1: Map views of P wave isotropic tomography and azimuthal anisotropy. The orientation and length of the white bars denote the fast-velocity direction and the amplitude of azimuthal anisotropy, respectively. The background colors show P wave velocity variations from isotropic tomography. The red circles and the red thick line in (d)–(f) typically depict the circular pattern of azimuthal anisotropy and deflected mantle flow, respectively. GV = Great Valley; PR = Peninsular Ranges; SN = Sierra Nevada; ST = Salton Trough; ECSZ = Eastern California Shear Zone; IB = Inner Borderland.

Figure 2: Vertical cross sections of P wave isotropic tomography and radial anisotropy. The horizontal white bars indicate that the horizontal velocity is faster than the vertical velocity and vice versa. The length of the bars denotes the amplitude of radial anisotropy. Red stars and triangles denote large earthquakes (M > 6.0) and Cenozoic volcanoes, respectively, within a 50-km width of each profile. BR: Basin and Range; CR: Coast Ranges; MB: Mojave Block.
Full article: https://doi.org/10.1029/2018JB015873